
Cryptocurrency Correlation: How to Measure Risk and Diversify Your Portfolio
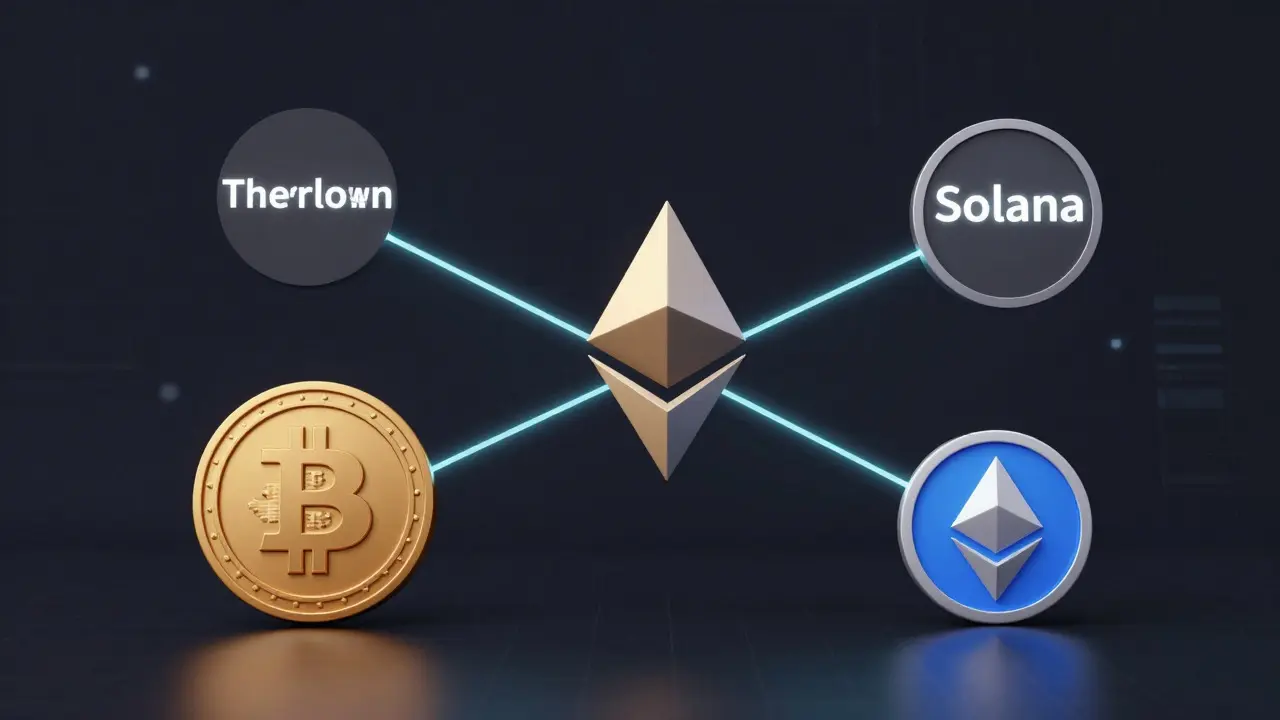
Imagine you bought Bitcoin, Ethereum, and Solana because you thought you were spreading your risk. Then the market crashes. All three drop by nearly the same percentage in a single day. You didn’t actually diversify; you just tripled your exposure to the same market sentiment. This is the trap of cryptocurrency correlation.
In traditional finance, we know that stocks, bonds, and gold often move differently. That difference is what protects wealth during downturns. In crypto, however, assets tend to hug each other tightly. Understanding this relationship isn't just academic-it’s the difference between a balanced portfolio and a concentrated bet disguised as a diversified one.
What Is Cryptocurrency Correlation?
Correlation is a statistical measure that describes how two assets move in relation to each other. It doesn’t predict price direction; it predicts movement synchronization. The standard metric used is the correlation coefficient, denoted as r. This number ranges from -1 to +1.
- +1 (Perfect Positive Correlation): When Asset A goes up, Asset B goes up by a proportional amount. They move in lockstep.
- 0 (No Correlation): The movement of Asset A has no predictable effect on Asset B.
- -1 (Perfect Negative Correlation): When Asset A goes up, Asset B goes down. This is rare in crypto but common between certain traditional assets like equities and safe-haven bonds.
If Bitcoin and Ethereum have a correlation of 0.85, they are moving together strongly. If you hold both, you aren’t hedging against each other; you’re amplifying volatility. For investors, the goal is usually to find assets with low or negative correlations to smooth out returns.
How to Measure Crypto Correlation
You don’t need a Bloomberg Terminal to calculate this. While institutional traders use complex models, individual investors can get accurate results using standard tools. Here is the practical workflow.
- Gather Data: Download historical price data for the assets you want to compare. Sources like CoinMarketCap or CoinGecko provide CSV exports. Ensure you use daily closing prices for consistency.
- Calculate Returns: Correlation works best on percentage changes (returns), not raw prices. If Bitcoin was $60,000 yesterday and $63,000 today, the return is 5%. Do this for every day in your dataset.
- Choose Your Method: The most common method is the Pearson Correlation Coefficient. It measures linear relationships and is the industry standard. For non-linear patterns, analysts sometimes use Spearman rank correlation, but Pearson is sufficient for most portfolio checks.
- Compute the Matrix: Use Excel, Google Sheets, or Python. In Excel, the function is
=CORREL(array1, array2). If you are analyzing five coins, you’ll create a matrix showing how each coin correlates with every other coin.
For those comfortable with coding, Python libraries like Pandas make this trivial. A simple df.pct_change().corr() command generates a full correlation matrix instantly. This allows you to visualize relationships across dozens of assets simultaneously.
The Bitcoin-Ethereum Anchor Effect
In the crypto ecosystem, Bitcoin acts as the market anchor. Most altcoins derive their value partly from network effects and partly from speculative liquidity that flows through Bitcoin first. Consequently, almost all cryptocurrencies show high positive correlation with Bitcoin.
Data from early 2023 showed the 24-hour correlation between Bitcoin and Ethereum at 0.82. Over a six-month window, this rose to 0.90. This means that for every 1% move in Bitcoin, Ethereum moves roughly 0.9% in the same direction. This tight coupling suggests that holding BTC and ETH offers minimal diversification benefit during normal market conditions.
However, this correlation isn’t static. During periods of extreme stress, such as the collapse of FTX in late 2022, correlations across the board spiked toward 1.0. When fear dominates, investors sell everything regardless of fundamentals. Conversely, during bull markets driven by specific narratives (like DeFi summer or NFT booms), smaller caps may decouple from Bitcoin, offering temporary diversification opportunities.
| Asset Pair | Typical Correlation Range | Diversification Value |
|---|---|---|
| Bitcoin & Ethereum | 0.75 - 0.90 | Low |
| Bitcoin & Stablecoins (USDT/USDC) | ~0.0 | High (Cash equivalent) |
| Ethereum & Solana | 0.80 - 0.95 | Very Low |
| Bitcoin & Gold | 0.10 - 0.30 | Moderate |
| Bitcoin & S&P 500 | 0.20 - 0.40 | Moderate |
Crypto vs. Traditional Assets: The Diversification Myth?
One of the main arguments for buying crypto is that it behaves differently than stocks. But does it? Research indicates that cryptocurrency correlation with traditional assets is weak but present. Specifically, crypto shows stronger alignment with growth-oriented tech stocks than with value stocks or bonds.
A study comparing digital currencies to active funds found that small-cap growth funds had a correlation of 0.41 with Bitcoin, while small-cap value funds had a correlation of only 0.35. This makes sense because both crypto and growth stocks are sensitive to interest rates and liquidity conditions. When the Federal Reserve raises rates, expensive money hurts speculative assets first.
However, the correlation is far lower than within traditional asset classes themselves. Mid-cap value and small-cap value funds often correlate at 0.97. By comparison, Bitcoin’s 0.35-0.41 link to stocks means it still offers some diversification benefits, provided you accept its higher volatility. It is not a perfect hedge, but it is not identical to the stock market either.
Why Correlations Change Over Time
Static correlation numbers can be misleading because they assume the past will repeat exactly. In reality, crypto correlations are dynamic. They shift based on market regimes.
During the COVID-19 pandemic, correlations among major cryptocurrencies spiked as panic selling unified the market. As stability returned in 2023 and 2024, these correlations drifted back down toward pre-pandemic levels. This phenomenon is modeled using advanced techniques like DCC-GARCH (Dynamic Conditional Correlation Generalized Autoregressive Conditional Heteroskedasticity). While you don’t need to run these models manually, understanding their implication is crucial: correlations rise during crises and fall during calm periods.
This means your diversification strategy must adapt. In a bull market, you might rotate into lower-correlation assets like niche Layer-1 tokens or real-world asset (RWA) protocols. In a bear market, sticking to large caps might be safer because liquidity dries up in smaller, less correlated projects.
Practical Strategies for Investors
So, how do you use this information? Here are three actionable steps to manage your portfolio using correlation insights.
- Check Before You Buy: Before adding a new token to your portfolio, check its correlation with your existing holdings. If it correlates above 0.8 with Bitcoin, ask yourself if you really need another Bitcoin proxy. Consider if it adds unique utility or just similar risk.
- Include Non-Correlated Assets: True diversification requires assets that don’t move together. Incorporate stablecoins for cash management. Consider allocating a portion to traditional assets like bonds or gold, which historically have low correlation with crypto.
- Monitor Regime Shifts: Set up alerts or monthly reviews to check correlation trends. If you notice Bitcoin’s correlation with the Nasdaq rising sharply, it may signal that macroeconomic factors are dominating crypto prices, suggesting a need to reduce overall risk exposure.
Advanced investors also look at Stablecoins not just as storage but as a tool. Since they have near-zero correlation with volatile assets, shifting a portion of your portfolio to USDC during high-volatility periods effectively lowers your portfolio’s beta without selling off gains.
Limitations of Correlation Analysis
Correlation is a powerful tool, but it has blind spots. First, correlation does not imply causation. Just because Bitcoin and Ethereum move together doesn’t mean one causes the other to move; they likely respond to the same external factor, such as regulatory news or macroeconomic data.
Second, historical correlation does not guarantee future performance. As mentioned, correlations break down during black swan events. Third, standard Pearson correlation assumes a linear relationship. Some crypto assets may have non-linear behaviors-for example, an asset might only move when Bitcoin drops below a certain threshold. In these cases, more complex methods like Spearman rank correlation or machine learning models (such as LSTM networks) might provide better insights, though they require significant technical expertise.
Finally, liquidity matters. A micro-cap coin might show low correlation with Bitcoin simply because it trades so rarely that its price doesn’t update frequently. This creates a false sense of diversification. Always ensure you are analyzing liquid assets with sufficient trading volume.
Is it possible to have zero correlation between cryptocurrencies?
True zero correlation is extremely rare among volatile cryptocurrencies because they all share the same underlying blockchain infrastructure risks and investor sentiment drivers. However, some specialized assets, like privacy coins or specific algorithmic stablecoins, may occasionally show lower correlation due to unique regulatory pressures or mechanical failures that affect them independently of the broader market.
How often should I recalculate my portfolio's correlation?
For active traders, weekly checks are advisable. For long-term holders, a monthly review is sufficient. Correlations can shift rapidly during earnings seasons, Fed announcements, or major crypto-specific events like ETF approvals or protocol upgrades. Regular monitoring ensures your diversification strategy remains effective.
Does high correlation mean I should avoid holding multiple altcoins?
Not necessarily. High correlation means you lack diversification, which increases risk. If you believe in the technology behind multiple altcoins, you can still hold them, but you should size your positions accordingly. Avoid over-concentrating in highly correlated assets unless you are prepared for synchronized drawdowns. Consider balancing them with uncorrelated assets like stablecoins or traditional securities.
Can correlation help predict price movements?
Correlation alone cannot predict price direction. It only tells you how assets move relative to each other. However, combined with other indicators, it can be useful. For example, if Bitcoin starts rising but Ethereum lags significantly despite a high historical correlation, it might signal weakness in Ethereum-specific fundamentals, presenting a potential arbitrage or rotation opportunity.
What is the difference between Pearson and Spearman correlation in crypto?
Pearson measures linear relationships and is sensitive to outliers, making it ideal for standard price return analysis. Spearman measures monotonic relationships (whether variables move in the same direction, regardless of linearity) and is better suited for ranked data or non-normal distributions. In crypto, where extreme outliers are common, Spearman can sometimes provide a more robust view of rank-order consistency, though Pearson remains the industry standard for general reporting.
Carl Michaud
August 5, 2026 AT 22:23The retail masses are too stupid to understand that correlation is just a tool for the central bankers to herd you into liquidation zones. They want you holding ETH and SOL because they move together, making it easy for the whales to dump on both simultaneously while you think you're 'diversifying'. It's a psychological trap designed to keep your liquidity trapped in their ecosystem.
Eric Zehr
August 6, 2026 AT 22:25Great point about the psychological aspect, but I think there is real value in understanding the math behind it. If we can identify assets that actually decouple during stress, like certain RWA tokens or stablecoins, we can build a much more resilient portfolio. It’s not all conspiracy; sometimes it’s just basic risk management working as intended.
Namrata Mapgaonkar
August 8, 2026 AT 09:42i always thought buying diff coins was enough lol.. never knew about this correlation thingy :/ maybe i should check my portfolio again.. thanks for sharing tho! :)
Rita Dutta
August 9, 2026 AT 13:35Oh, the grand illusion of diversification! We dance to the tune of Bitcoin, thinking our altcoin melodies are unique symphonies, but really we are just echoes in a canyon. The market is a beast that devours nuance, leaving only the raw meat of sentiment. Correlation is the leash, and we are all dogs barking at the same moon, unaware we are tethered by the same invisible chain of fear and greed. How tragic, how beautiful, how utterly predictable.
Paul Smith
August 10, 2026 AT 23:24Haha, Rita, you always make things sound so poetic 😂 But seriously, this post is super helpful! I’ve been using Excel to track my BTC and ETH correlation, and wow, it’s scary how close they are. Time to look into some gold or bonds maybe? 📉📈
Rodmun Tarnowski
August 12, 2026 AT 00:05This is an exceptionally well-researched article!! The breakdown of Pearson vs Spearman correlation is particularly insightful!!! Most investors ignore these statistical nuances at their own peril!!! I highly recommend everyone here to calculate their own correlation matrices immediately!!! It is the only way to truly understand your exposure!!!
Matthew Smith
August 13, 2026 AT 02:34morality has no place in markets yet we pretend ethics guide our buys. correlation is cold truth. you hold what you hold. if it moves with btc you are exposed. simple. stop pretending your niche coin is special when the macro winds blow hard. it is not. accept the volatility or leave.
Prudence Flemming
August 14, 2026 AT 10:24the epistemological crisis of crypto investing lies in assuming historical linearity predicts future non-linear chaos. beta is a ghost. correlation is a shadow. until we model the stochastic nature of sentiment shifts via monte carlo simulations of regime changes we are merely gambling with spreadsheets. jargon aside its true though most portfolios are just leveraged btc bets.
Matt Kay
August 15, 2026 AT 15:17boring read. charts dont pay bills.
Dave Kjendal
August 16, 2026 AT 21:07you guys overthink it. buy low sell high. correlation is for nerds who cant handle losing money anyway. if you panic sell when btc drops 10% then yeah maybe check your math but otherwise just hodl. life is short why waste time on excel sheets?
Kat Bennett
August 17, 2026 AT 00:12I found myself nodding along as I read through the section on dynamic correlations because it really resonates with my experience during the last bear market where everything seemed to crash in unison regardless of the fundamental differences between the projects which made me realize that perhaps the investor psychology plays a larger role than the technology itself when it comes to price action especially during times of extreme fear and uncertainty in the broader financial system.
Candice Cornett
August 18, 2026 AT 00:31everyone says diversify but nobody wants to hold boring assets. you want excitement not stability. so you buy solana and ethereum and call it a day. delusional. if you want safety go buy treasury bonds. if you want crypto take the hit. stop whining about correlation when you chose the casino.
Lance Jantz
August 19, 2026 AT 23:41Ah, the exquisite agony of watching one’s portfolio synchronize in a macabre ballet of loss! 🎭 One might fancy oneself a connoisseur of digital scarcity, yet the market treats all such pretensions with the indifference of a glacier. To believe in diversification within this ecosystem is to believe in fairy tales told by venture capitalists seeking exit liquidity. Embrace the chaos, my friends, for it is the only constant! 🌪️
Don Fizy
August 20, 2026 AT 22:47Hey team! Don't let the complexity scare you off :) Start small. Just pick two coins you hold and check their correlation in Google Sheets. It takes 5 minutes and gives you peace of mind. You got this! Let me know if you need help with the formula! -Don :)
Phil Babb
August 22, 2026 AT 07:22LISTEN UP!!! This is critical information!!! If you are still holding a bag of random altcoins without checking their correlation matrix you are throwing money away!!! Get your act together!!! Calculate the returns!!! Use Python!!! Stop being lazy!!! Your portfolio deserves better!!!